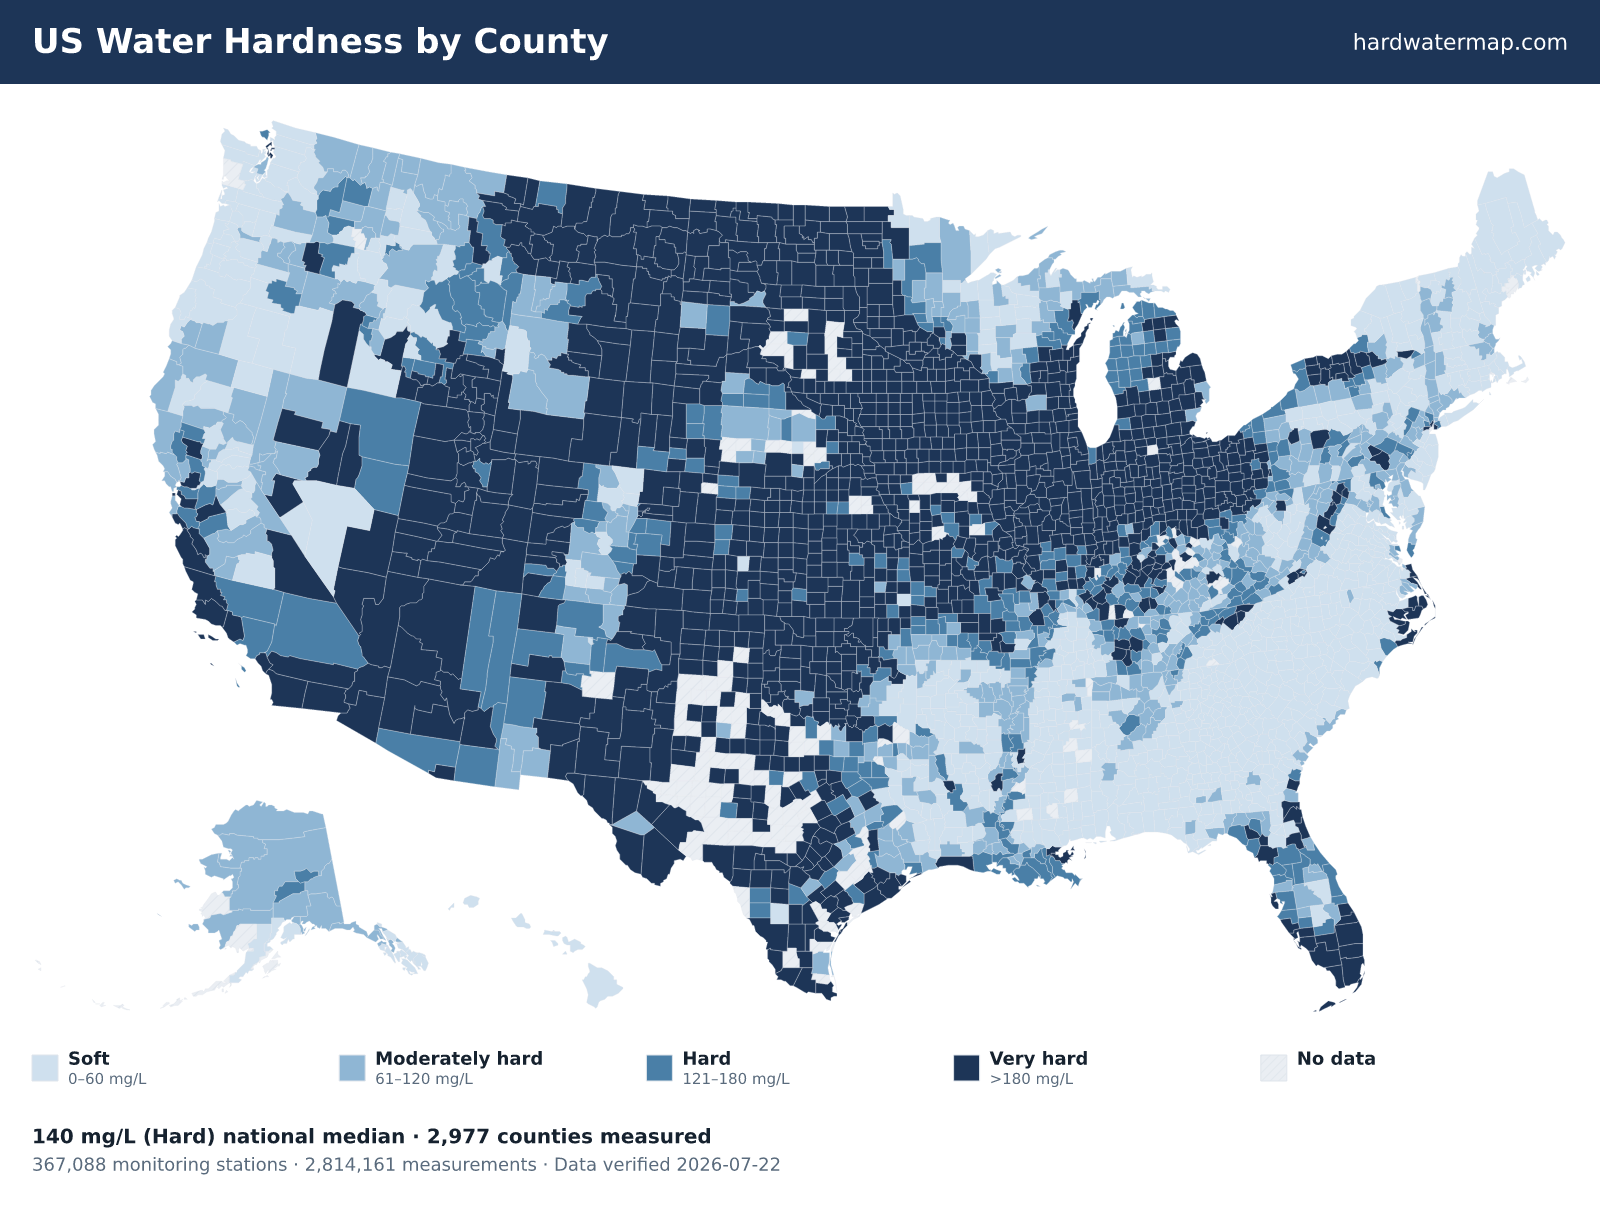
This map shows water hardness for every measured US county, built from 2,814,161 laboratory measurements at ~367,000 USGS and EPA monitoring stations. The national county median is 140 mg/L as CaCO₃ — "hard" on the USGS scale. Counties without sufficient public data are shown in gray, not estimated.
127.9Mlive in very-hard counties
56.8%in hard-or-worse water
2,977US counties mapped
The whole country painted from measured data — how this map is built. A hard water map of the United States at county resolution, not city pins.
County water hardness
counties
Soft0–60 mg/L862
Moderately hard61–120 mg/L474
Hard121–180 mg/L393
Very hard>180 mg/L1,248
No datanot estimated
mg/L as CaCO₃ — higher = harder
Gray marks counties with too few public measurements to report — shown as gaps, not estimated. 2,977 counties have enough data to map. Download the US water hardness map (PNG).
2,814,161 measurements~367,000 stationsUSGS/EPA Water Quality Portalverified 2026-07-22updated quarterlyhow it's built →
Explore
Is there hard water in my area?
Three ways to find out. The map above is the picture — pan to your county or search your state. The ZIP lookup finds the utility serving your address, plus your county's measured hardness. And your county's row on its state page gives the measured median from local samples. Hardness varies within a state, so check your own area rather than assume the average.
Address-level results resolve to your water utility on the lookup page.
Data
Hardest and softest states
The gap between hardest and softest is enormous: South Dakota's statewide median of 391 mg/L is 24× Maine's 16 mg/L. Where your state sits on that range decides whether hardness is a daily reality or a non-issue.
Median mg/L as CaCO₃. 127.9M live in very-hard counties; 56.8% in hard-or-worse. Full statistics →
By state
Water hardness by state
Water hardness in the US follows the geology. The Plains, Upper Midwest, and Southwest run hardest — South Dakota, Iowa, North Dakota, Arizona, and Illinois top the table, all limestone and carbonate-rich groundwater. New England and the Southeast Atlantic run softest, where granite and coastal-plain aquifers leave little calcium behind. See the full ranking on the statistics page, or what each number means on the hardness scale.
Statewide median hardness (mg/L as CaCO₃), each state's silhouette filled by its band. Soft and hard water map, by state.
Tools
Tools & calculators
Every tool here starts from one number — your hardness in mg/L or grains. Get it from the map or the calculator, then size a softener, set its dial, or estimate salt without guessing.
Hardness is just dissolved calcium and magnesium, but it drives scale, soap use, and appliance life. These explainers cover what it is, how to read the scale, and how to tell hard from soft — each built on the same measured data as the map.
The full dataset is yours: all 2,977 gated counties with median, band, sample count, station count, and newest year, as a single CSV. It's CC BY 4.0 — use it, chart it, cite it; a link back to hardwatermap.com is all we ask.
Short answers to what people ask most about US water hardness — each links to the page that goes deeper.
Which state has the hardest water?
South Dakota has the hardest tap water of any state, with a statewide median of 391.4 mg/L as CaCO₃. See the full ranking on the statistics page.
What does this map actually measure?
Each county is colored by the median of all measured hardness samples within it — a pooled value from many USGS and EPA monitoring stations, not a single reading. Source: the USGS/EPA Water Quality Portal.
Why is my county gray?
Gray counties do not have enough public measurements to report — fewer than 8 results, fewer than 2 stations, or no reading since 1995. We show that absence rather than estimate a number.
The “85%” figure is widely repeated but unsourced. By the USGS definition (hardness above 120 mg/L), a measured 55% of gated US counties are hard or harder, and about 56.8% of the US population lives in hard-or-worse counties — counties and people are two different measures. See the breakdown.
How hard is the water in my area?
Three ways: pan the map to your county, search your ZIP to find your utility, or open your state page for the measured county median. Hardness varies locally, so check your own area rather than the state average.